Checklist for analyzing any stock in 10 minutes
Learn how to analyze a company's stock with this complete guide
Investing in the stock market can feel overwhelming. You log into a financial news site and are immediately hit with flashing tickers, complex charts, and expert opinions that all seem to contradict each other. It feels like you need a finance degree just to understand the basics, let alone pick a winning stock.
But what if you could cut through the noise? What if you had a simple, repeatable process to analyze any stock in about 10 minutes?
This isn’t about a “get rich quick” secret. Let’s be perfectly clear: a deep, thorough analysis of a company can take days or weeks. However, you don’t need to do a deep dive on every stock. You need a filter—a quick “screener” to help you decide if a company is even worth your time.
This checklist is your filter. It’s designed to help you spot the obvious winners and, more importantly, the obvious losers, in just 10 minutes. By focusing on a few key metrics, you can quickly assess a company’s health, valuation, and competitive advantage, saving you hours of research on dead-end stocks.
Important Disclaimer: This article is for informational and educational purposes only. It is not financial advice. All investments carry risk, and you should conduct your own thorough research or consult with a qualified financial advisor before making any investment decisions.
Before You Start: What Does “Analyzing a Stock” Really Mean?

Before we start the timer, let’s align on our goal. When you “analyze a stock,” you are not analyzing a digital ticker symbol on a screen. You are analyzing a business.
A stock is simply a tiny piece of ownership in a real-world company—a company with employees, products, customers, and debts. Your goal is to determine if this business is:
- Healthy: Is it making more money than it spends? Is it growing?
- Durable: Does it have a “moat” or a competitive advantage that protects it from rivals?
- Well-PricED: Is the price you’re paying for your piece of the business fair, cheap, or way too expensive?
Our 10-minute checklist will touch on all three of these points. You’ll need a good financial website or app—like Yahoo Finance, Google Finance, or your own brokerage’s research tools. Open up the summary page for the stock you want to analyze, and let’s begin.
Step 1 (Minute 1): Can You Explain the Business in One Sentence?
This is the most important step, and it’s not a number. It’s the “Peter Lynch” test, named after the legendary investor who said, “Never invest in any idea you can’t illustrate with a crayon.”
- What It Is: A simple, qualitative check.
- Why It Matters: If you don’t understand how a company makes money, you have no way of knowing why it might stop making money. You can’t assess its competition or its future growth if its business model is a black box to you.
- Your 1-Minute Action: Read the “Business Summary” or “About Us” section. Can you explain to a friend what this company actually does?
- Good: “Coca-Cola (KO) makes and sells beverage concentrates and syrups to bottlers worldwide.” (Simple!)
- Good: “Microsoft (MSFT) makes most of its money from cloud services (Azure), software (Windows, Office), and hardware (Xbox).” (Clear!)
- Red Flag: “They are a diversified holdings company leveraging synergistic-blockchain-based AI solutions for the fintech and biotech space.” (What?! This is a pass. If you don’t get it, you can’t analyze it.)
If you can’t understand it, close the tab. There are thousands of other stocks.
Step 2 (Minute 2): What Is the P/E Ratio and Is the Stock Overpriced?
Now we look at the “price tag.” The most common metric for this is the Price-to-Earnings (P/E) ratio.
- What It Is: The P/E ratio tells you how much investors are willing to pay for every $1 of the company’s annual profit. You’ll see it listed clearly on every stock quote page.
- Why It Matters: It’s a quick gauge of whether a stock is considered cheap or expensive by the market.
- Your 1-Minute Action: Find the “P/E Ratio (TTM)” (TTM means “trailing twelve months”).
- A “high” P/E (e.g., 30+) suggests investors expect high growth in the future.
- A “low” P/E (e.g., under 15) suggests the company may be undervalued or in a slow-growth industry.
- A “negative” P/E means the company isn’t profitable (it has no “E”). This is common for new, high-growth startups but is a major red flag for established companies.
Crucial context: A P/E ratio is useless in a vacuum. To know if a P/E of 25 is “good” or “bad,” you must compare it to two things:
- Its Competitors: If Coca-Cola’s P/E is 25 and Pepsi’s is 24, they’re similarly valued. If Coca-Cola’s is 25 and a small, no-name soda company’s is 80, the second one looks extremely expensive.
- The Broader Market: The S&P 500 (an index of the 500 largest US companies) has a historical average P/E of around 15-20.
Checklist Pass: The P/E is positive and generally in line with its direct competitors and the market average.
Step 3 (Minute 3): Is the Company Growing? Analyzing Revenue and Earnings Trends
A business that isn’t growing is dying. You want to see a company that is consistently increasing its sales and, more importantly, its profits.
- What It Is:
- Revenue (or “Sales”): The total amount of money the company brought in. This is the “top line.”
- Earnings (or “Net Income”): The profit left over after all costs, expenses, and taxes are paid. This is the “bottom line.”
- Why It Matters: You want to invest in a business that is expanding. Consistent revenue growth shows demand for its products. Consistent earnings growth shows the company can manage its costs as it gets bigger.
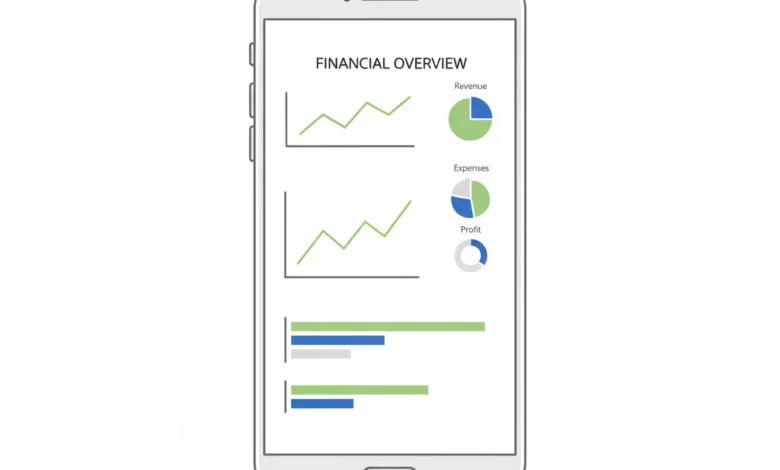
- Your 1-Minute Action: Find the “Financials” tab. Most sites will have a simple bar chart showing the last 3-5 years of revenue and earnings.
- Good: You see two bar charts, both steadily climbing “up and to the right.”
- Red Flag: You see flat, erratic, or (worst of all) declining bars. This shows the business is shrinking or struggling.
You don’t need to be an accountant. You’re just looking for the trend. Is the business getting bigger or smaller?
Step 4 (Minute 4): How Much Debt Is Too Much? A Look at the Balance Sheet
Debt is a tool. It can be used to build new factories and grow, or it can be a crushing weight that sinks a company during a recession. You need to know how much debt the company is carrying.
- What It Is: The Debt-to-Equity Ratio (D/E). This ratio compares the company’s total liabilities (what it owes) to its shareholder equity (what it owns).
- Why It Matters: A company with too much debt is fragile. If a bad year hits, all its cash might go to paying interest on its loans instead of growing the business or surviving the downturn.
- Your 1-Minute Action: Find the “Statistics” tab and look for the “Debt-to-Equity” ratio.
- Generally Safe: A D/E ratio under 1.0 is often considered very healthy.
- Generally Okay: A D/E between 1.0 and 2.0 is common.
- Red Flag: A D/E ratio above 2.0 or 3.0 (or one that is much higher than its competitors) indicates significant risk.
Caveat: This is industry-specific. Banks and utility companies naturally operate with very high debt. Tech companies (like Google or Apple) often have almost no debt. The key, once again, is to compare it to its industry peers.
Step 5 (Minute 5): How Efficient Is the Business? Decoding Profit Margins

A company can have $100 billion in revenue, but if it costs them $101 billion to get it, it’s a bad business. This is where profit margins come in.
- What It Is: The “Net Profit Margin” tells you what percentage of every $1 in sales the company keeps as pure profit.
- Why It Matters: A high profit margin means the company is efficient, has a strong brand (allowing it to charge higher prices), or has a low-cost operation. A low margin means it’s in a brutal, low-price “commodity” business.
- Your 1-Minute Action: Look for “Net Profit Margin (TTM)” on the “Statistics” tab.
- Bad: 0-5%. This is a razor-thin margin (common for grocery stores, for example).
- Solid: 10%.
- Great: 20%+.
- Exceptional: 30%+ (often found in software or high-end luxury goods).
Analogy: Imagine two lemonade stands. Stand A sells $100 of lemonade and makes $2 profit (2% margin). Stand B sells $100 and makes $25 profit (25% margin). Which business would you rather own? Stand B, every time.
Step 6 (Minute 6): Does the Company Pay You to Own It? The Dividend Yield
Some companies take their profits and reinvest them all back into the business to grow (like Amazon or Google for most of their history). Other, more mature companies, take their profits and return a portion to shareholders as a cash payment, called a dividend.
- What It Is: The “Forward Annual Dividend Yield.” This is the percentage of the stock’s price that the company pays you back in cash each year.
- Why It Matters: Dividends are a sign of a stable, profitable, and confident business. It’s a tangible return on your investment.
- Your 1-Minute Action: Find the “Dividend Yield.”
- 0%: This is a “growth stock.” It doesn’t pay a dividend. This is fine, but it means your only return will come from the stock price going up.
- 1-4%: This is a solid, sustainable yield, common for mature companies (think Coca-Cola, Home Depot, or many banks).
- Red Flag (Yield Trap): A very high yield (e.g., 8%, 10%, or more) can be a trap. It often means the stock price has fallen dramatically because the company is in trouble, and the dividend is likely to be cut.
A dividend is a bonus, but a stable one is a great sign of financial health.
Step 7 (Minute 7): What Is the “Economic Moat”? Assessing Competitive Advantage
This is another qualitative check, made famous by Warren Buffett. A “moat” is a durable competitive advantage that protects a company from its rivals, just like a moat protects a castle.
- What It Is: The reason why customers choose this company over its rivals.
- Why It Matters: A company with no moat will see its profits competed away. A company with a wide moat can protect its profit margins for decades.
- Your 1-Minute Action: Ask yourself: “Why do people buy from this company?”
- Brand: (Apple, Coca-Cola) People pay more for the brand.
- Network Effect: (Visa, Facebook) The service becomes more valuable as more people use it.
- Switching Costs: (Microsoft, your bank) It’s a huge pain to switch to a competitor.
- Cost Advantage: (Walmart, Amazon) They can sell things cheaper than anyone else.
If you can’t identify a strong moat, the company is vulnerable.
Step 8 (Minute 8): Who Is Running the Show? A Quick Look at Management

When you buy a stock, you are hiring the CEO and their team to manage your money. It’s a good idea to know who they are.
- What It Is: A quick check on the leadership team.
- Why It Matters: A great management team can steer a mediocre business to success, while a bad one can drive a great business into the ground.
- Your 1-Minute Action:
- Find the CEO’s name.
- Check their tenure. Have they been there for a while, or is it a revolving door?
- Go to a site like Glassdoor and look up the company’s “CEO Approval Rating.” Is it 90% or 30%? This is a powerful “insider” view from employees.
- Check “Insider Ownership” on the “Statistics” tab. Do managers (insiders) own a lot of the stock? If they do, their interests are aligned with yours.
Step 9 (Minute 9): What Are the Headlines? Scanning the Recent News
You’re not looking for “buy” recommendations. You’re looking for disasters.
- What It Is: A scan of the last few weeks of news headlines for the company.
- Why It Matters: You need to check for any immediate, company-breaking problems.
- Your 1-Minute Action: Click the “News” tab.
- Ignore: “This Stock is Set to Soar!” or “Top 5 Stocks to Buy Now.” This is noise, not news.
- Look For: “SEC Investigation,” “Class-Action Lawsuit,” “Product Recall,” “CEO Steps Down,” “CFO Resigns,” “Accounting Scandal,” or “Guidance Cut.”
Any of these “red flag” headlines are a clear sign to stop and dig much deeper, or just walk away.
Step 10 (Minute 10): How Does It Stack Up? Comparing Against Competitors
You should never analyze a company in a vacuum. A stock might look “good,” but what if it’s the worst-performing company in a high-flying industry?
- What It Is: A final benchmark against its top rivals.
- Why It Matters: This puts all the other numbers (P/E, Debt, Margin) into context.
- Your 1-Minute Action: Most finance sites have a “Competitors” or “Peers” tab. Click it.
- You’ll see a small table comparing your stock’s key metrics (P/E, Profit Margin, D/E) against its top 2-3 rivals.
- How does it stack up?
- Is it the industry leader, or the laggard?
- Is it cheaper (lower P/E) but also less profitable (lower margin)?
- Is it more expensive, but growing much faster?
This final check helps you confirm if you’ve found a high-quality business or the “best-looking house in a bad neighborhood.”
Your 10-Minute Analysis Is Done: What’s the Next Step?

Congratulations. The timer is up.
You’ve just completed a high-speed “triage” of a stock. You now have a solid, fact-based opinion on its business model, valuation, financial health, and competitive position.
Based on this checklist, you should be able to place the stock into one of three buckets:
- The “No” Bucket (The Obvious Losers): These companies have declining revenue, massive debt, no clear business model, or are involved in a major scandal. You’ve just saved yourself hours of research. Close the tab and move on.
- The “Maybe” Bucket (The Deep Dive List): This stock looks promising. It passed most of your checks. It has a clear business, reasonable debt, good margins, and a fair price. It has now earned your time. This stock goes on your “research list” for a true deep dive.
- The “Too Hard” Bucket: You don’t understand the business, the financials are too complex, or you just can’t get a good read on it. That’s fine! The most important part of investing is knowing what you don’t know. Put it aside and move on to something simpler.
What Is a “Deep Dive”?
For stocks that land in the “Maybe” bucket, the 10-minute check is just the beginning. The real work comes next. This is what separates casual speculators from serious investors. A deep dive (which takes hours, not minutes) includes:
- Reading the 10-K: This is the company’s annual report filed with the SEC. It’s the “owner’s manual” and contains far more detail than any news site.
- Listening to Earnings Calls: This is where the CEO and CFO talk directly to investors and answer tough questions.
- Building a Real Valuation: Going beyond the P/E ratio to understand the company’s future cash flows.
- Analyzing the Total Addressable Market (TAM): Understanding how big the company can realistically get.
The Power of a Process
Investing doesn’t have to be a gamble. It can be a disciplined process. By using this 10-minute checklist, you remove emotion, hype, and FOMO (Fear Of Missing Out) from the equation.
You’re no longer just buying a ticker symbol because it went up. You’re becoming a true business analyst, filtering for quality, health, and value.
The goal isn’t to find a perfect stock—they don’t exist. The goal is to build a repeatable process that helps you identify good businesses at fair prices and avoid the obvious traps. This checklist is your first and most powerful tool to do just that.